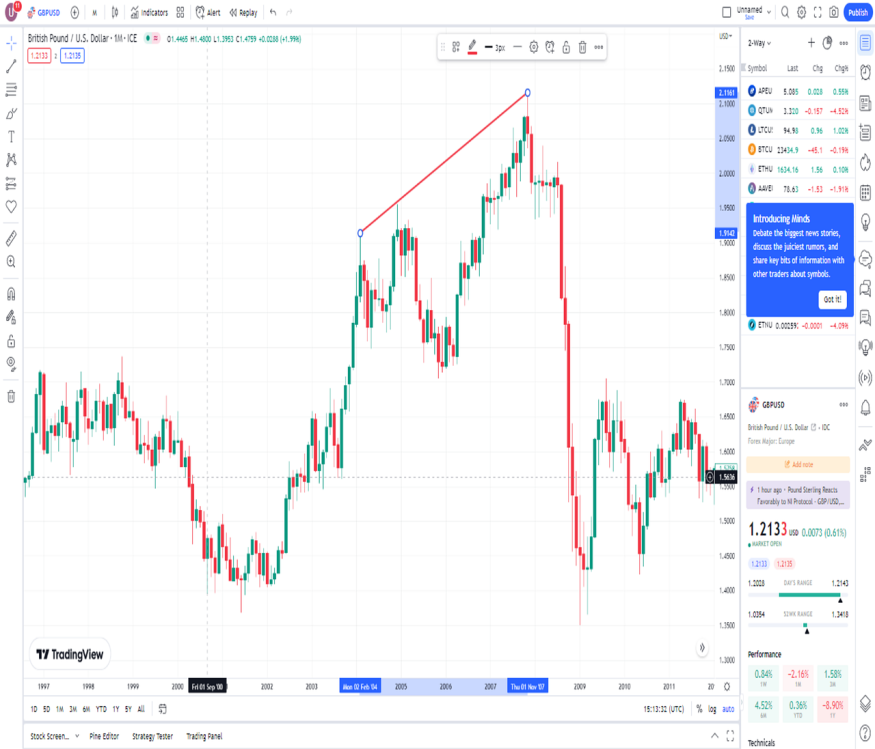
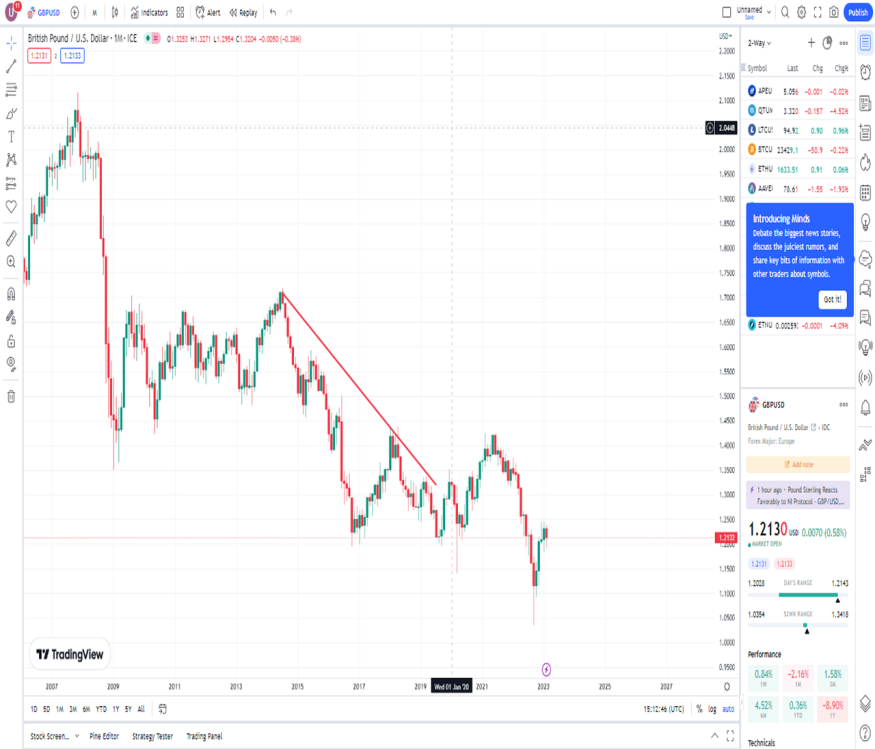
Fibonacci retracement levels form the foundation of Fibonacci trading. When combined with other technical tools like RSI, MACD, and moving averages, they are an asset for any trader. Here's an in-depth guide to help you kick off your analysis using Fibonacci retracement.
What Are Fibonacci Retracements?

Fibonacci retracement levels are strategic price points on a chart that help traders know any asset's support and resistance levels. They work by using the famous Fibonacci ratios on historical charts of that asset. The Fibonacci ratios represent relationships that stem from the Fibonacci sequences. Key Fibonacci ratios include 0%, 23.6%, 38.2%, 50%, 61.8%, and 100%.
Once these levels are identified on the chart, traders will have a good idea of the following support or resistance level. Support levels are like floors beneath the price, where buying interest is strong enough to prevent further decline. In contrast, resistance levels act like ceilings above the price, where selling pressure stops upward movement.
These levels are significant because they provide traders with clear reference points to identify strategic locations for placing trades, setting target prices, or determining stop losses. Traders prefer to buy near the support level and sell near the resistance level to capitalize on predictable price movements.
It is based on the theory that following a price shift upwards or downwards, the emergence of new support and resistance levels often align closely with these reference lines.
While the 50% retracement level isn't a Fibonacci ratio, it is commonly used because assets tend to continue moving in a direction after completing a 50% retracement.
The Basis of the Fibonacci Retracements Pattern
Currency pairs often retreat a bit after a move before changing direction. These retracements typically happen at three levels. 38.2%, 50% and 61.8% as per Fibonacci analysis.
Using Fibonacci retracement levels in forex trading helps estimate how much a currency might retreat before resuming its trend direction. The key point to note about the Fibonacci tool is that it is most effective during trending markets.
First, swing highs and swing lows should be located to identify these retracement levels.
Swing highs mark the moments on a chart when a security price peaks before declining, while swing lows indicate points where the price hits bottom before bouncing. These high and low points indicate trends as support and resistance levels.
Once you locate these points on your chart, your charting software takes care of the rest, eliminating the need for calculations. To identify an uptrend, simply select the Swing Low. Move the cursor towards the Swing High. For downtrends, choose the Swing High. Drag the cursor towards the recent Swing Low.
The general strategy involves buying on a pullback at a Fibonacci support level in an uptrend and selling on a pullback at a Fibonacci resistance level in a downtrend.
Uptrend

In the above scenario, suppose GBP/JPY has a swing low at 170 and a swing high at 190. We then apply Fibonacci retracement levels to the price range between these points.
The retracement levels calculated from the abstract chart would be 186 (23.6%), 183.8 (38.2%), 182.5 (50.0%), 181.2 (61.8%), and 179.9 (76.4%).
During an uptrend, the general expectation is that GBP/JPY, when retracing from its recent high, might find support at one of these Fibonacci levels. This is because traders tend to place buy orders as the price returns to these levels.
The theoretical representation of Fibonacci retracement in an uptrend is as follows:
In subsequent price action, after reaching the swing high, the price might retrace through the 23.6% level and continue its decline over the following weeks. It could test the 38.2% level but not close below it. If the market resumes its upward trajectory later, surpassing the swing high, buying at the 38.2% Fibonacci level would likely result in a profitable long-term trade.
Downtrend

In a different scenario, let's suppose GBP/JPY has a swing high at 210 and a swing low at 190. Again, we apply Fibonacci retracement levels to the price range between these points.
The retracement levels in this downtrend would be 207 (23.6%), 205.6 (38.2%), 204.5 (50.0%), 203.4 (61.8%), and 202.3 (76.4%).
During a downtrend, the expectation is that if GBP/JPY retraces upwards from this low, it will likely face resistance at one of these Fibonacci levels. This is because traders are prepared with sell orders at these levels.
The theoretical representation of Fibonacci retracement in a downtrend is as follows:
In subsequent price movement, the market might attempt to rally, stall below the 38.2% level, and then test the 50.0% level. Placing sell orders at either the 38.2% or 50.0% levels could result in significant gains.
In these scenarios, the price displays temporary support or resistance at Fibonacci retracement levels.
Guidelines for Effective Fibonacci Chart Plotting
Step 1: Determine the High and Low
Highlight the relative high and low prices on a historical chart. A longer timeframe increases the likelihood that the Fibonacci retracement lines will highlight significant support and resistance levels.
Step 2: Establish Fibonacci Retracement Levels
After selecting a high and low for a specific period, sketch the Fibonacci retracement percentage levels on the chart. The low point signifies 0%, while the high point denotes 100%. Plotting the key Fibonacci percentage lines of 38.2%, 50%, and 61.8% is recommended between these points.
Step 3: Analyze Historical Behavior
After placing the plotted lines on the chart, observe which Fibonacci levels have exhibited support and resistance during the relevant historical period. These areas objectively demonstrate that retracement has occurred upon approach.
Step 4: Predict Future Movement
The successful application of Fibonacci techniques relies heavily on accurately interpreting previous price movements within the identified range. Once you identify the correct Fibonacci retracements, you can forecast entry and exit points for trading positions based on the evident historical patterns.
The Role of Fibonacci Retracement in Forex Trading Strategies
Fibonacci retracement can give traders a clearer perspective on potential support and resistance levels. Regardless of personal beliefs, their widespread usage creates a self-fulfilling prophecy for these levels. However, you should combine these techniques with other technical analysis tools for a comprehensive trading strategy.
© 2025 ScienceTimes.com All rights reserved. Do not reproduce without permission. The window to the world of Science Times.


