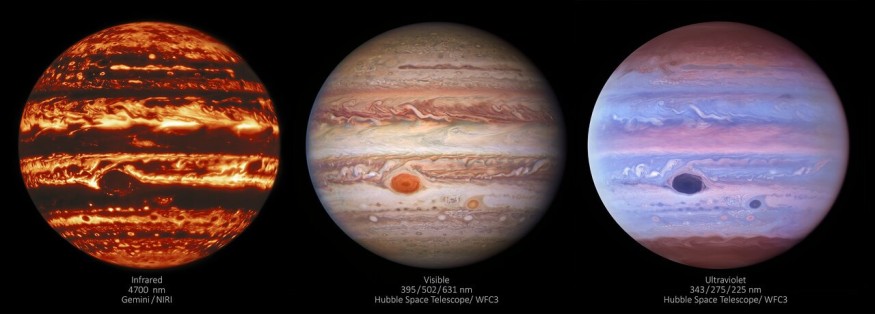
Newly processed images from the Hubble Space Telescope and the Gemini North observatory in Hawaii show specifics of Jupiter's tumultuous atmosphere in various wavelengths. The recent discovery assisted scientists in determining what causes the gas giant's massive storms to shape.
The images were recorded in infrared, visible, and ultraviolet wavelengths. Scientists processed them to allow interactive side-by-side comparison of the various views of the clouds above the gas giant.
Astronomers can learn more about Jupiter's atmosphere by studying the planet's evolving appearance in various wavelengths. The Great Red Spot, a massive superstorm that persists south of Jupiter's equator, is clearly visible in visible and ultraviolet light but fades into the background in the infrared.
The dark area showing the Great Red Spot in the infrared image is larger than the corresponding red oval in the visible image, according to the contrast between the three forms of wavelengths. The difference is because each imaging technique captures various properties of the planet's atmosphere. National Optical-Infrared Astronomy Research Laboratory (NOIRLab) published the images on Tuesday.
How The Images Looked Like

While infrared observations reveal areas covered in dense clouds, visible and ultraviolet images reveal the positions of chromophores. These are molecules that absorb blue and ultraviolet light and give the spot its distinctive red color. Jupiter's counter-rotating bands of clouds, on the other hand, are visible in all three views.
The photographs were taken at the same time on January 11, 2017. Space.com said the Hubble Space Telescope's Wide Field Camera 3 captured the ultraviolet and visible images, while the Near-Infrared Imager (NIRI) instrument at Gemini North in Hawaii captured the infrared image.
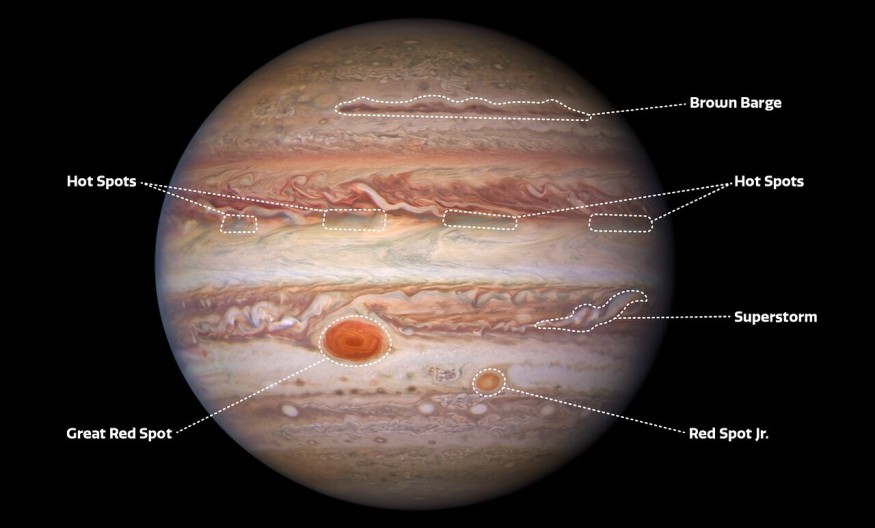
The Hubble photos also show the smaller Red Spot Jr, which formed in 2000 when three storms of similar size combined southwest of the larger superstorm. The "Junior" is barely visible in the infrared wavelength, disappearing into the wider band of cooler clouds, much like the Great Red Spot.

In contrast to the red dots, an infrared image clearly shows a cyclonic vortex spreading from east to west. This nearly 45,000-mile-long (72,000-kilometer) vortex system appears as a bright line in the planet's northern hemisphere.

The cyclone appears dark brown at visible wavelengths, leading to the nickname "brown barges" in photographs from NASA's Voyager spacecraft, which flew past the gas giant in 1979. However, at ultraviolet wavelengths, the feature is scarcely visible under a layer of stratospheric haze that darkens as it approaches the north pole.
Stormy Jupiter
University of California scientist Mike Wong compared the images to radio signals observed by NASA's Juno spacecraft, which is currently studying the earth. Lightning in Jupiter's atmosphere is indicated by certain radio signals. Wong and his team were able to explore different layers of the cloud structure by integrating the three types of images with the lightning data to gain a deeper understanding of the formation mechanisms behind Jupiter's massive storms.
"Juno detected a whole bunch of lightning flashes at radio wavelengths that are associated with cyclones," Wong told CNN. "And we interpreted the data to show that when you have active convection, which is generating the lightning, you have this particular situation where there's three types of clouds all jumbled together in one place: the really tall convective towers, clearings where Gemini detects bright emission, and deep water clouds," he added.
Despite the fact that many robotic space missions have visited Jupiter, scientists still have several unanswered questions about the planet's formation and processes.
The Juno mission's funding from Hubble and Gemini also provides researchers with a window into Jupiter's overall atmosphere, including wind patterns, airwaves, and cyclones, as well as its gases and heat.
This data set will also serve as the foundation for Wong's potential research into how and why the Great Red Spot appears to be dying. Though scientists aren't sure why the storm has been shrinking since 1930 when astronomers started studying it and taking measurements.
Since Jupiter's atmosphere is continually changing, long-term observation campaigns can be used to monitor changes over time. Scientists are looking forward to seeing what new surprises Jupiter has in store for us in the future.
Check out more news and information on Space on Science Times.


