
Math is super important when it comes to trading. It's not just something you learn in school; it's a tool that traders use every day to build strategies and make predictions. Whether you're dealing with forex, crypto, or stocks, learning how mathematical models work can really help you improve.
Math helps traders look at complicated market data and find patterns you otherwise would not discover with the human eye. From figuring out simple averages to using complex algorithms that analyze data in real-time, math is behind a lot of what traders do. By knowing these models, traders can predict market movements, optimize their investments, and manage risks better as you will see soon.
There are different types of mathematical models in trading, and each one has its own use. Here are a few important ones:
- Statistical models: These models use past data to predict future market trends. They can be simple analyses or more advanced methods like regression analysis and time series forecasting.
- Stochastic models: These models deal with the randomness of markets. They help traders understand the likelihood of different outcomes when things are uncertain.
- Optimization models: These models try to get the best returns while minimizing risks by figuring out the best way to allocate assets in a portfolio. Techniques like linear programming and quadratic optimization are often used.
- Algorithmic trading models: These are automated models that make trades based on set rules. They can handle huge amounts of data and make trades much faster than any human can.
By using these mathematical models, traders can get a big advantage in the market.
Stochastic Processes and Market Predictions
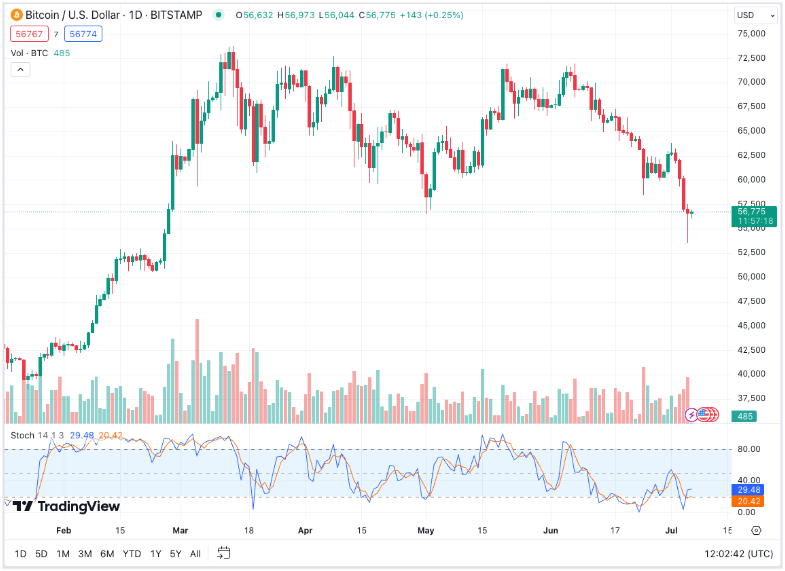
Explanation of stochastic processes
Stochastic processes might sound complicated, but they're basically just ways to predict random events. In trading, we use these processes to try and figure out what might happen next in the market. Think of it like trying to predict the weather; it's never 100% certain, but we use patterns and data from the past to make our best guess.
Application in predicting market trends
In the world of trading, predicting market trends is super important. Stochastic processes help traders make educated guesses about where the market is headed. By looking at past data and patterns, traders can identify trends in buying or selling stocks, forex, or cryptocurrencies. It's kind of like connecting the dots to see the bigger picture and make smarter trading choices.
Here's how traders use stochastic processes:
- Collect data: Gather historical market data.
- Analyze patterns: Look for recurring trends and patterns in the data.
- Make predictions: Use the identified patterns to predict future market movements.
- Test predictions: Compare predictions with actual market outcomes to refine the model.
Example
Imagine you're a trader looking at the forex market. Over the past few months, you notice that every time a certain economic report is released, the value of a particular currency pair goes up. Using a stochastic process, you analyze this pattern and predict that the next time this report is released, the currency pair will likely increase in value again. You decide to buy the currency pair before the report comes out, hoping to profit from the anticipated rise.
Risk Management and Leverage
Mathematical models for managing leverage and risk
Using leverage can be risky, so it's important to manage it carefully. These models can calculate the potential gains and losses from a trade, helping traders decide how much leverage to use.
One common model is the Risk of Ruin formula, which helps traders understand the probability of losing their entire investment. This formula considers factors like the size of the trading account, the size of the trades, and the probability of winning or losing each trade. By using this formula, traders can determine the optimal amount of leverage to use, reducing the risk of losing all their money.
Another useful model is the Kelly Criterion, which helps traders determine the best size for their trades to maximize growth while minimizing risk. This model uses the probability of winning and losing to calculate the optimal percentage of the trading account to risk on each trade. By following the Kelly Criterion, traders can manage their leverage more effectively, avoiding excessive risk while still aiming for growth.
Explanation of leverage in trading
Imagine you have $1,000, and you want to buy stocks. Without leverage, you can only buy $1,000 worth of stocks. But with leverage, you can borrow money to increase the size of your investment. For example, if you use 10:1 leverage, you can control $10,000 worth of stocks with your $1,000. This means if the stock price goes up, your gains are much bigger. However, if the price goes down, your losses are also much bigger.
Leverage is often used in forex, crypto, and stock markets. In forex trading, for instance, leverage ratios can be as high as 100:1, meaning you can control $100,000 worth of currency with just $1,000. In crypto trading, leverage can also be substantial, allowing traders to take advantage of highly cryptocurrencies.
In finance, leverage allows traders to control a large position in a market with a relatively small amount of money. Visit https://leverage.trading/ to get more general and detailed information about how leverage trading works, as it can significantly boost both gains and losses.
Game Theory

Game theory is a fascinating branch of mathematics that studies the interactions and decisions of individuals or groups who are trying to achieve their goals. It's like a big, complicated game where each player's move can affect the outcome for everyone involved. In the context of trading, game theory helps traders understand and anticipate the actions of others in the market.
In trading, every decision you make can be thought of as a move in a game. For example, deciding when to buy or sell a stock or whether to enter or exit a trade can be influenced by what you think other traders will do. Game theory helps traders develop strategies by considering the possible reactions of other market participants.
One popular concept in game theory is the Nash Equilibrium, which is a situation where no player can benefit by changing their strategy while the other players keep theirs unchanged. In trading, reaching a Nash Equilibrium can mean finding a stable strategy where your actions are optimized based on the anticipated moves of others.
Examples of game theory application in market scenarios
There are many ways game theory can be applied to real market scenarios. Here are a few examples:
- Predicting market movements:
- Traders can use game theory to predict market movements by analyzing how different players, such as investors, companies, and governments, might react to various economic events. For instance, if a company announces a significant earnings increase, traders might predict that others will buy the stock, driving up the price.
- Bidding in auctions:
- In financial markets, auctions are common, especially for things like government bonds. Game theory helps traders decide how much to bid by considering how other participants are likely to bid. This helps them avoid overpaying or losing out to higher bids.
- Negotiating trades:
- When traders negotiate large trades, game theory helps them strategize their offers and counteroffers. By understanding the likely responses of the other party, traders can negotiate better deals.
- Timing the market:
- Deciding when to enter or exit a trade can be crucial. Game theory can help traders understand the likely timing of other market participants' actions. For example, if many traders are likely to sell at a certain price level, it might be wise to sell just before that to get a better price.
Overall, game theory is a powerful tool that transforms trading into a strategic battle of wits. By understanding the actions and reactions of other market participants, traders can outsmart the competition and navigate the complexities of the financial markets with greater confidence. So next time you're pondering your next move in the market, remember: it's not just about the numbers; it's about playing the game smarter than everyone else. Ready to level up your trading strategy? Read more about game theory and see how far it can take you.
Optimization Techniques for Portfolio Management
Optimization in trading is all about making the best possible choices to maximize profits while minimizing risks. It's like finding the perfect balance between different factors to get the best outcome. Traders use various mathematical techniques to figure out the best way to allocate their resources, like money and time, across different investments.
There are several methods traders use to optimize their portfolios:
- Mean-variance optimization: This method involves calculating the expected returns and the variance (or risk) of different investments. By doing this, traders can create a portfolio that offers the highest expected return for a given level of risk. It's like trying to get the most bang for your buck without taking too many chances.
- Risk parity: In risk parity, traders try to balance the risk across all the assets in their portfolio. Instead of putting all their eggs in one basket, they spread out their investments so that no single asset dominates the risk. This way, if one investment performs poorly, it doesn't have a huge impact on the overall portfolio.
- Factor investing: This method involves selecting investments based on certain factors that are believed to drive returns, such as value, momentum, or quality. By focusing on these factors, traders can build a portfolio that is more likely to perform well over time.
How mathematical optimization is applied in risk management
Mathematical optimization plays a crucial role in risk management. By using mathematical models, traders can predict potential losses and take steps to mitigate them. For example, they might use algorithms to determine the optimal mix of assets that will minimize risk while still achieving their investment goals.
One common technique is Value at Risk (VaR), which estimates the maximum loss a portfolio might experience over a given period with a certain level of confidence. Another is Stress Testing, where traders simulate extreme market conditions to see how their portfolio would hold up under pressure.
Conclusion
Mathematics is vital in trading, providing tools and techniques for market predictions and risk management.
Here's a brief recap:
- Mathematical models: Essential for interpreting market data from simple averages to complex algorithms.
- Stochastic processes: Help predict market trends by analyzing historical data and patterns.
- Leverage and risk management: Techniques like the Risk of Ruin formula and the Kelly Criterion guide smart leverage use.
- Game theory: Assists in developing strategies by anticipating market participants' actions.
- Optimization techniques: Methods such as mean-variance optimization and risk parity balance risk and return, optimizing portfolios.
As technology and data analysis advance, the role of mathematics in trading will continue to grow. Future innovations will enhance market predictions, investment optimization, and risk management, making mathematical knowledge increasingly critical for successful trading.


